
Data Analysis using Python and Jupyter Notebook
Python is a programming language for data analysis and may organizations are using python to analyze their huge volume of data in the current industrial world so in this blog we are going to learn that how we can use python programming to analyze data sets using anaconda Jupiter lab.
Fist download and install anaconda in your machine so please find the link below
https://www.anaconda.com/distribution/
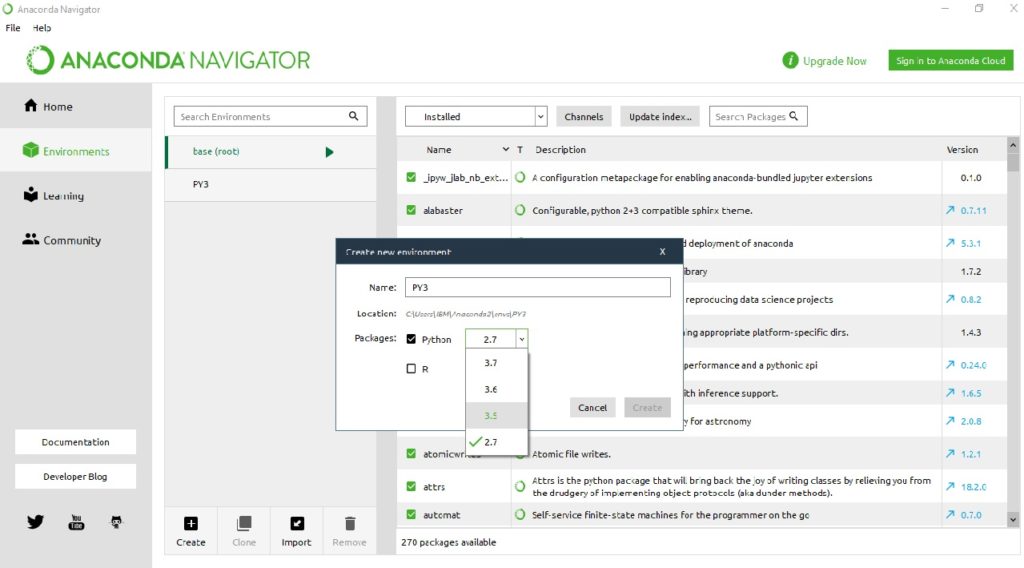
Now start anaconda and create a new python environment PY3 as we are going to work on python 3.5 and install required libraries for data analysis like NumPy, pandas,matplotlib.
just click on the environment tab and create a new environment for python 3.5.
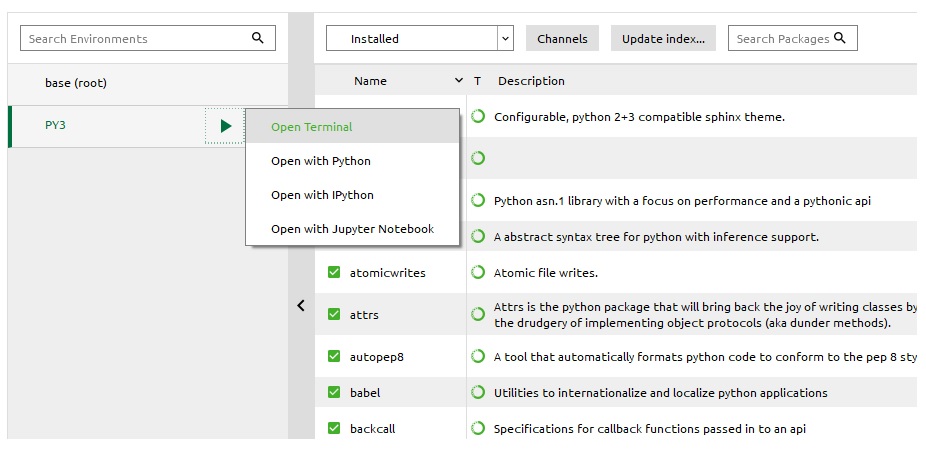
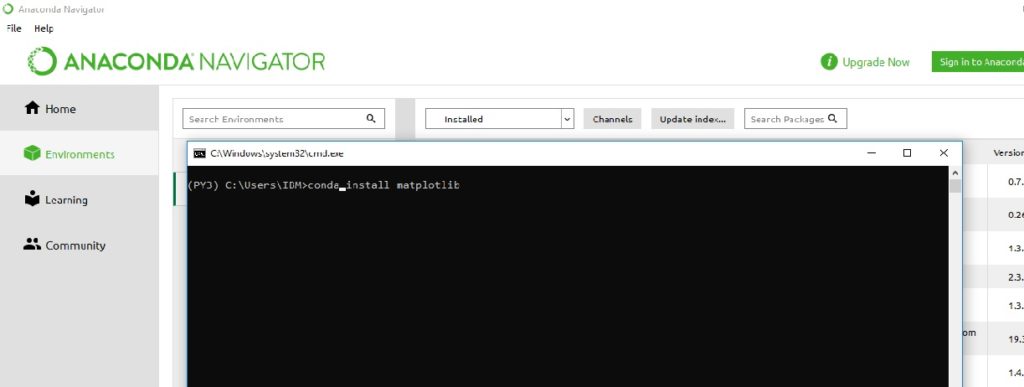
Now install python libraries form anaconda prompt just click on the play button besides PY3 and select open in the terminal and then run commands
1-pip install pandas
2-pip install matplotlib or condo install matplotlib.
3-pip install NumPy
4-pip install pywin32 (for windows)
5-pip install seaborn
6-pip install statsmodels
7-pip install -U scikit-learn
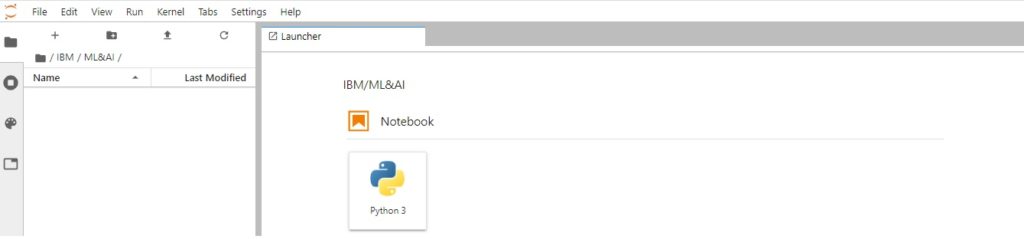
After the successful installation of the PY3 environment select the home tab and start Jupyter lab. It is a notebook tool where you can write python code and can visualize your result so create a new notebook for your project. just click on file new ->notebook->select python3
copy and paste the below code and click on the play button to execute your code.
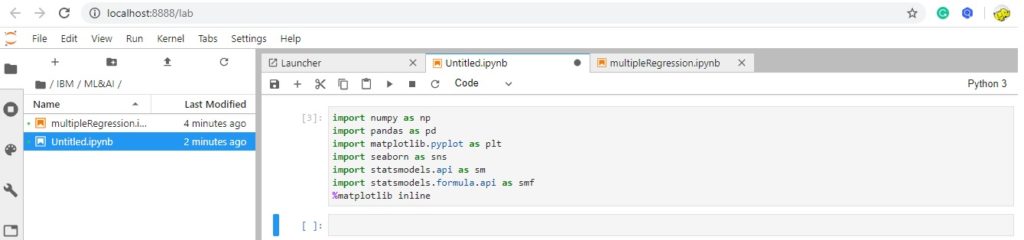
import numpy as np
import pandas as pd
import matplotlib.pyplot as plt
import seaborn as sns
import statsmodels.api as sm
import statsmodels.formula.api as smf
%matplotlib inline
Now we are going to create a dataframe using pandas.dataframes are having 2d structure like RDBMS tables and keeping a collection of records.
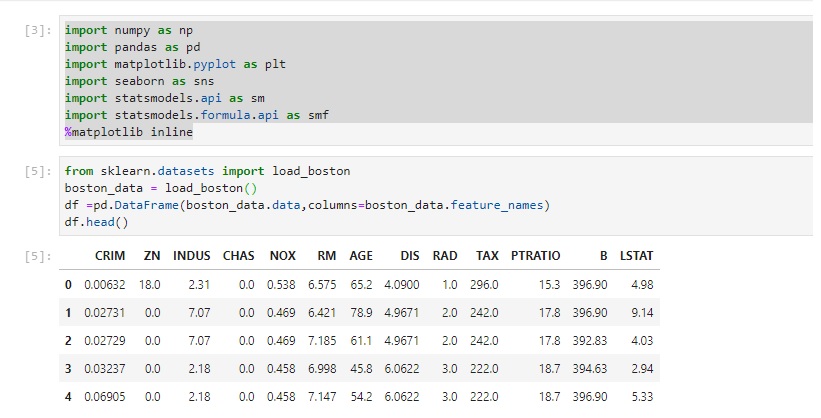
from sklearn.datasets import load_boston
boston_data = load_boston()
df =pd.DataFrame(boston_data.data,columns=boston_data.feature_names)
df.head()
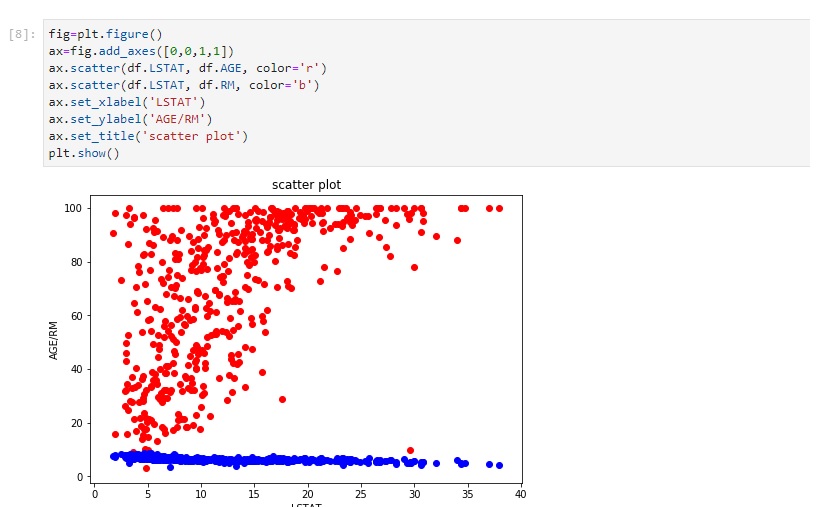
Going to plot our data using matplot library.
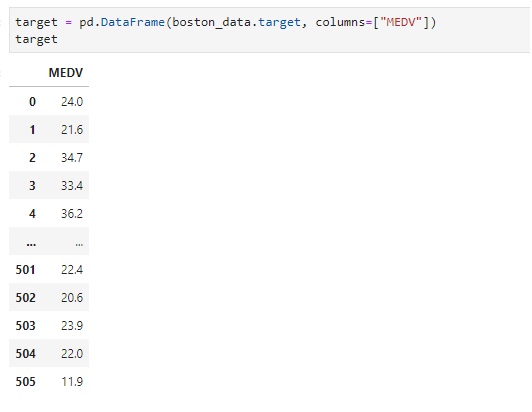
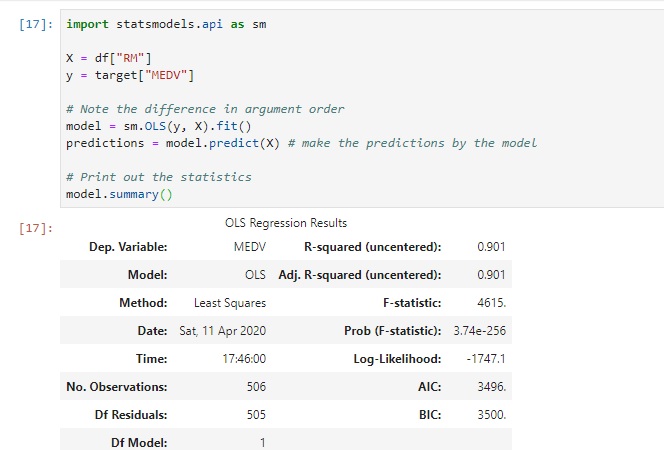
getting the target values from the dataset inside the target variable and passing x and y columns inside our linear model to predict the target.
Applying an analytical model and getting model summery
THANK YOU.